In the popular picture of how AI companies use compute, there are two big buckets: training and inference. But in reality, the R&D side is more complex. The final training run — the one that produces the model with a name — is only the last step in a long, expensive process of exploration. Before that run begins, companies burn through compute on: running experiments at various scales, generating synthetic data, testing which ideas work before committing to a final run, and training models that are never released.
This distinction matters. When people discuss compute thresholds or the cost of training a frontier model, they often mean the final training run. However, the full cost of developing that model is much higher. And if most of the spending is exploration rather than execution, then a competitor who learns what works from the frontier could replicate the results for a fraction of the original cost.
So there’s more to R&D compute than final training runs, but how much? Last year, we estimated the breakdown of OpenAI’s 2024 compute spending at around $5 billion on R&D compute that year, with only about $500 million – roughly 10% – going to the final training runs that produced released models such as GPT-4.5. The rest went to scaling experiments, synthetic data generation, basic research, or other R&D workloads.
However, that estimate only looked at a single company (OpenAI) for one year (2024). It’s hard to know how general this pattern is, since companies rarely disclose how they allocate their compute.
But in early January, two smaller Chinese AI companies, MiniMax and Z.ai, disclosed their R&D compute spending as part of their IPO processes. Since most of MiniMax and Z.ai’s models are also published, we can estimate how much compute went to their final training runs, and compare.
We find that the pattern holds: for all three companies, final training runs account for a minority of R&D compute spending despite major differences in scale, country, and business model. We also explore what these ratios might tell us about catch-up growth: companies that can learn from the frontier should in theory need less experimentation and devote more of their R&D compute to training. MiniMax’s higher ratio is consistent with this, but Z.ai’s is not, and with only three data points, the evidence remains inconclusive.
Breaking down MiniMax and Z.ai’s compute spending
Our analysis relies on two types of data: the R&D compute spending and the final training run compute spending.
The R&D compute spending comes directly from MiniMax’s and Z.ai’s IPO documents. Both companies went public on the Hong Kong Stock Exchange in early January 2026. Since their disclosed financials do not cover the full year 2025, we have to instead rely on the most recent periods available: For MiniMax, we use reported compute spending from Q4 2024 to Q3 2025, and for Z.ai, we use H2 2024 to H1 2025.
Following the procedure in our OpenAI estimate, we match the reported spending window to the training compute of models released one quarter later. For MiniMax, we look for the training compute of models released in 2025. For Z.ai, we look for the training compute of models released in 2024 Q4 – 2025 Q3. This accounts for the fact that firms spend the R&D compute for a model several months before its public release.
Most of the final training run compute spending comes from our database of AI models, with several assumptions. Epoch reports the models’ training run compute in FLOP. To convert FLOP into USD, we use the following equation:
\(\text{Cost in USD} = \frac{\text{FLOP}}{\text{GPU peak FLOP/s} \times \text{MFU} \times 3600 \text{ seconds/hour}} \times \text{price/GPU hour}\)
Where:
- GPU peak FLOP/s = 9.89e14 (H800 dense BF16/FP16), unless developers specifically state the model is trained with FP8 precision.
- MFU (Model FLOP Utilization) is assumed to be 0.15-0.35 for pre-training and supervised fine-tuning1 and 0.05 - 0.20 for RL (reinforcement learning), since RL is inference-heavy and inference has a lower utilization than training. We propagate this MFU uncertainty by Monte Carlo simulation (a way to estimate uncertainty intervals through a series of calculations).
- Price/GPU hour is assumed to be $1.50 - $3.00. We also propagate this price uncertainty by Monte Carlo.
Sometimes, firms do not disclose sufficient information to estimate training compute with precision in our database of AI models. If so, we estimate a 90% confidence interval for the training compute of those models.
Most model estimates do not significantly affect the final total training compute, except for MiniMax’s Hailuo 02. We estimate a 90% CI for its compute spending of [$5M, $51M], with a median of $18M – about 40% of Minimax’s total 2025 training compute. We think this is reasonable, since Hailuo accounted for 32.7% of MiniMax’s 2025 revenue2 and training spend on a model tends to correlate with its commercial importance. Note that if we exclude the Hailuo model family entirely from the final training run compute, MiniMax’s training-to-R&D ratio is more on par with OpenAI’s training-to-R&D ratio, with a median of 12.2% and a 90% CI of [6.4%, 23.5%].3
Lastly, data for OpenAI’s compute allocation comes from our previous data insight.4
Final training runs are a small fraction of R&D compute spending
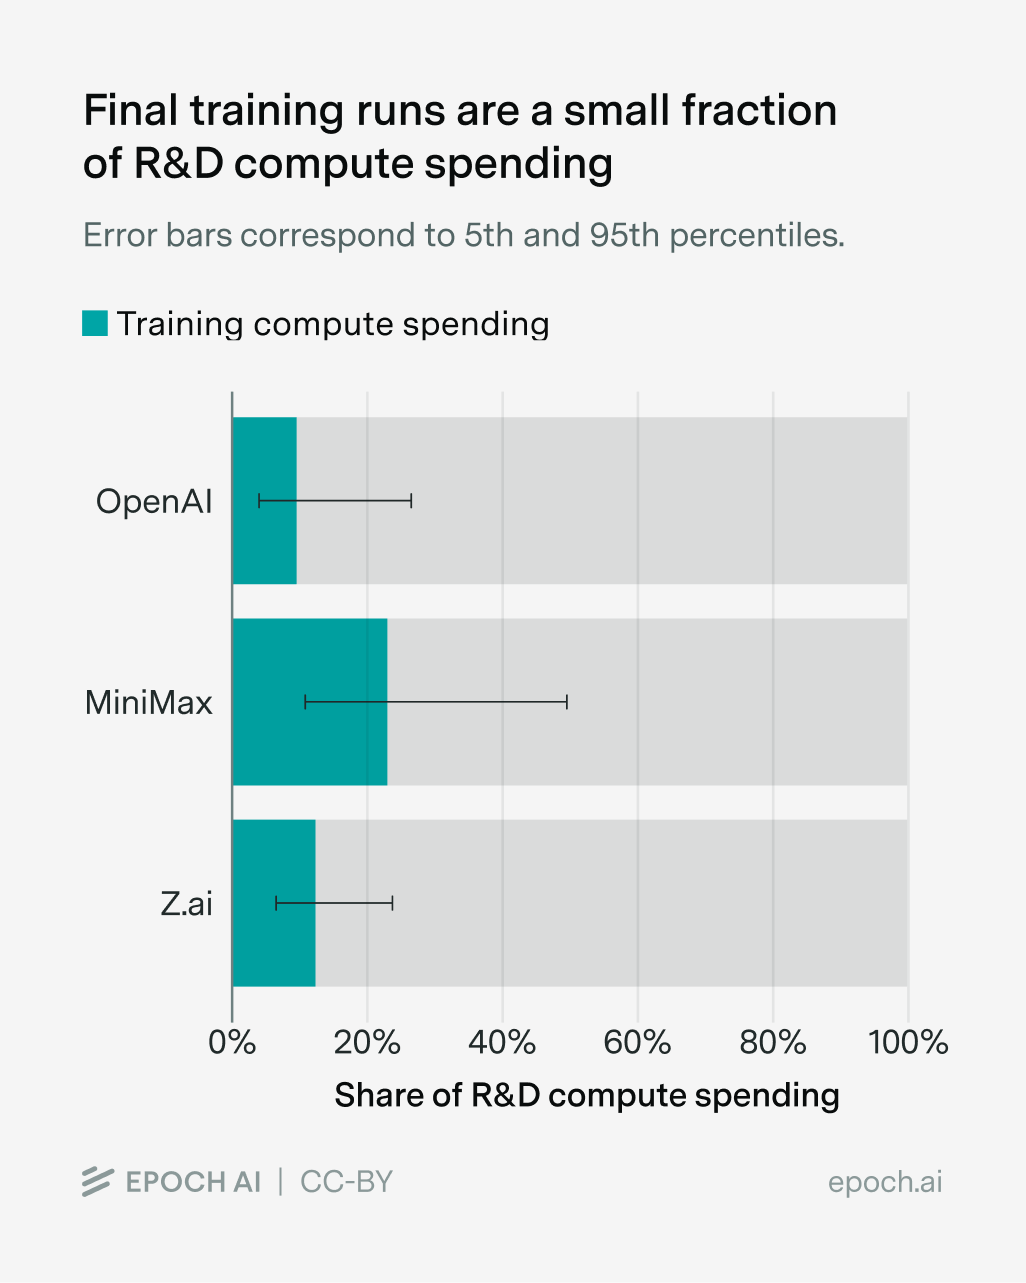
With these estimates in hand, here’s what we find. For all of OpenAI, Z.ai, and MiniMax, final training runs account for a small fraction of total R&D compute spending: 9.6% for OpenAI, 22.6% for MiniMax, and 12.3% for Z.ai. This pattern holds despite major differences between the three companies. OpenAI spent $5 billion on R&D compute in 2024, while MiniMax spent $141 million and Z.ai $216 million. They operate in different countries, under different regulatory environments, and with different business models. Yet in all three cases, the bulk of R&D compute spending went to something other than the final training runs for released models. This shows that our earlier findings on OpenAI in 2024 were not a fluke.
An important caveat is that these figures measure compute spending, not compute in terms of actual FLOP performed. This is particularly important because training runs and research often have different levels of MFU (Model FLOP Utilization), or how efficiently the GPUs are used. R&D workloads tend to achieve lower GPU utilization than final training runs, because experiments involve more overhead like waiting between runs, failed jobs, debugging, and other idle periods that lower GPU utilization. In contrast, final training runs optimize to keep hardware busy more consistently. As a result, even if the two activities incur the same spending, R&D could use fewer actual FLOP due to lower MFU.
R&D compute and catch-up growth
So far, we’ve focused on what these three companies have in common: final training runs are a small share of R&D compute spending in all three cases. But the ratios aren’t identical. Can we learn anything from the differences?
A major difference between OpenAI and Z.ai/MiniMax is that OpenAI operates at the frontier of AI capabilities, and is spending an order of magnitude more on compute. At the frontier, companies face many plausible research directions, so they need to spend heavily on experiments to figure out which ideas work at scale.
If a company is farther from the frontier, it should be able to learn what works from leading companies, skip much of this costly experimentation, and allocate more of its R&D compute to actual training runs. There are many ways this can happen: ideas spread through publications and rumors, competitors can train on data generated by frontier models, they can analyze a model’s behavior to reverse-engineer how it was built, or they simply learn that something is possible and focus their efforts accordingly.
This predicts that lagging companies should have higher training-to-R&D ratios than frontier companies. MiniMax fits this prediction: its ratio appears higher than OpenAI’s or Z.ai’s. This is also consistent with Anthropic’s disclosure that MiniMax ran a large-scale distillation campaign against Claude, extracting over 13 million exchanges (more than DeepSeek or Moonshot). Z.ai, on the other hand, doesn’t clearly fit the catch-up prediction, since its training-to-R&D ratio looks similar to OpenAI’s.5
Overall, we still only have three data points, with wide error bars on each. So these results don’t provide particularly strong evidence for or against the catch-up story. The pattern is suggestive in MiniMax’s case, but we can’t draw confident conclusions about what drives the differences in training-to-R&D ratios across companies. Better understanding the business models and incentives for Z.ai and MiniMax could help explain why the two companies seemingly differ in their R&D compute allocation.
Conclusion
Final training runs account for a minority of R&D compute spending across all three companies we examined: this confirms that the pattern we found for OpenAI in 2024 extends to smaller companies in a different country. The differences between companies are harder to interpret with so few data points.
We’d like to do this analysis for more companies, but the binding constraint is getting reliable data on compute spending. IPO disclosures have been our best source so far, and there may be more opportunities soon when OpenAI, SpaceX, and Anthropic IPO.
Thanks to Konstantin Pilz and Lynette Bye for helpful comments and editing.
Appendix
R&D Compute Spending
Minimax and Z.ai disclose the R&D compute in their IPO documents. In particular, Z.ai’s R&D compute is reported in RMB. To convert that to USD, we use an exchange rate of 7.2 RMB/USD, which was the average exchange rate in 2025.6
Final Training Run Compute Spending
By the “Final training run compute” of a model, we mean the compute used to train that model specifically, including pre-training and post-training. If a base model as well as a fine-tuned version of it were both released, we do not double-count the compute used to train the base model.
To estimate the cost of final training runs in USD, we use the aforementioned equation:
\(\text{Cost in USD} = \frac{\text{FLOP}}{\text{GPU peak FLOP/s} \times \text{MFU} \times 3600 \text{ seconds/hour}} \times \text{price/GPU hour}\)
We pair this with a Monte Carlo simulation of 50,000 draws to propagate uncertainty across our three input parameters:
- MFU, modeled as log-normally distributed, with the 10th and 90th percentiles anchored at 0.15 and 0.35 for pre-training and supervised fine-tuning, and 0.01 and 0.10 for RL post-training.
- Price/GPU hour, modeled as log-normally distributed, with the 10th and 90th percentiles anchored at $1.50 and $3.00.
- FLOP counts for models missing training compute information. We will explain in more detail the distribution below.
We also assume GPU peak FLOP/s = 9.89e14 FLOP/s (H800 dense BF16/FP16), unless developers specifically state the model is trained with FP8 precision, in which case we use GPU peak FLOP/s = 1.513e15 FLOP/s. Minimax-M2 is the only model trained with FP8 precision in our sample.
A key methodological choice concerns how uncertainty in MFU and price/GPU hour is handled across models. We assume these are largely market- or period-level conditions rather than model-specific parameters. Thus, in each Monte Carlo draw, we sample one common MFU and one common price/GPU hour and apply them to all models.
FLOP counts are primarily from our AI models dataset. Caveats and details are in model_flop.md in our GitHub repository.
Notes
-
We use a smaller utilization than the default in our AI models database because H800s have the same peak FLOP/s as H100s, but worse memory and interconnect bandwidth.

-
MiniMax Group Limited, Prospectus, Hong Kong Stock Exchange, December 2025, table: “Revenue breakdown by product and monetization method.”
-
However, this should be interpreted as a lower bound. In this exercise, we subtract Hailuo’s training compute from the total training compute (the numerator), but we do not subtract the R&D compute devoted to Hailuo from the total R&D compute (the denominator). If a substantial share of R&D compute was spent on Hailuo, then, the properly adjusted denominator should be smaller as well. So the reported 12.3% understates the training-to-R&D ratio for MiniMax by excluding Hailuo’s training compute.
-
Since our focus is on commercialized models, we omit any models that OpenAI, MiniMax or Z.ai have trained and served directly to customers, without public release. That said, we do not think this affects the results much. Indeed, it’s likely that all three companies either publicly released their largest models in 2025, or that the non-public models they commercialized were built by doing a small amount of additional training on top of the same backbones used for publicly released models.
-
There is some very weak evidence that Z.ai’s models may also have distilled from frontier companies: Andon Labs found that GLM-5 often identifies itself as Claude. However, this could also reflect training on AI-generated content on the web rather than targeted distillation, so we don’t put much weight on it.
-
MiniMax only uses cloud service for its R&D compute. Z.ai owns and leases some equipment and server infrastructure, but its public disclosures suggest that core training and R&D compute relies primarily on third-party compute services rather than a large self-built cluster. Accordingly, Z.ai’s disclosed R&D compute figure captures third-party compute service fees used in R&D, not a full measure of total R&D compute-related cost, since the prospectus does not separately report spending on internally owned hardware used for R&D.
About the authors