Executive summary
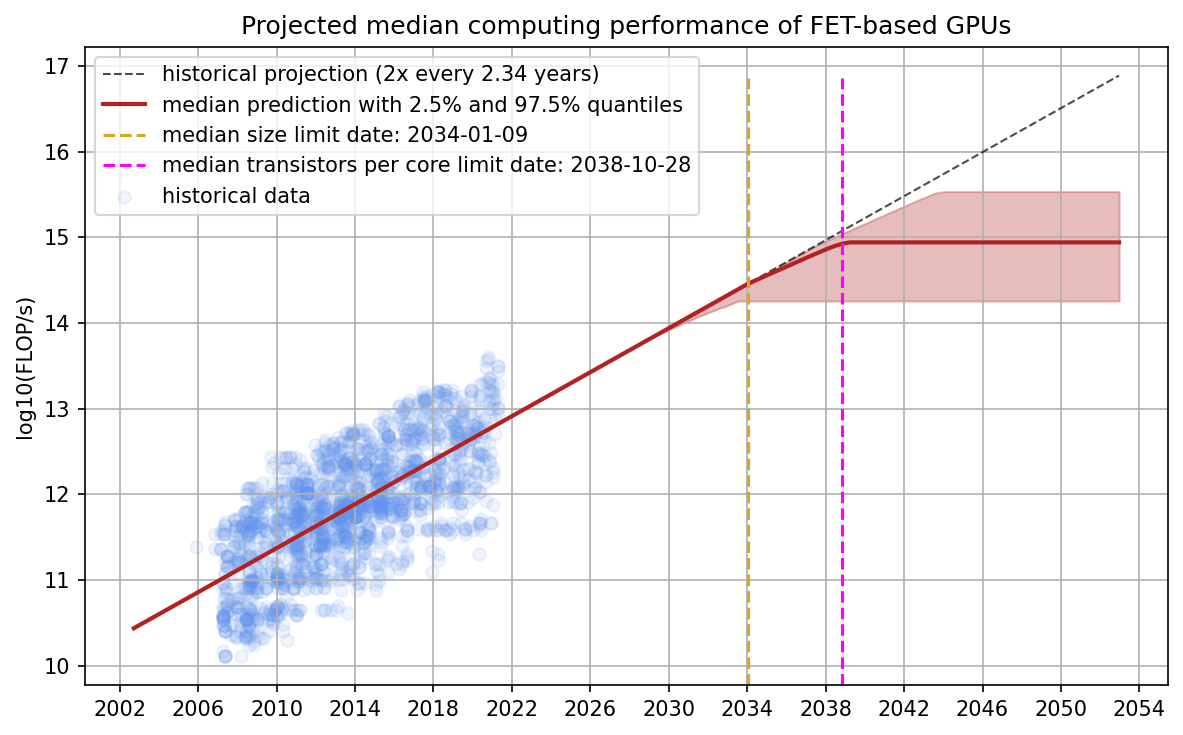
We develop a simple model that predicts progress in the performance of field-effect transistor-based GPUs under the assumption that transistors can no longer miniaturize after scaling down to roughly the size of a single silicon atom. We construct a composite model from a performance model (a model of how GPU performance relates to the features of that GPU), and a feature model (a model of how GPU features change over time given the constraints imposed by the physical limits of miniaturization), each of which are fit on a dataset of 1948 GPUs released between 2006 and 2021. We find that almost all progress can be explained by two variables: transistor size and the number of cores. Using estimates of the physical limits informed by the relevant literature, our model predicts that GPU progress will stop roughly between 2027 and 2035, due to decreases in transistor size. In the limit, we can expect that current field-effect transistor-based GPUs, without any paradigm-altering technological advances, will be able to achieve a peak theoretical performance of 1e14 and 1e15 FLOP/s in single-precision performance.
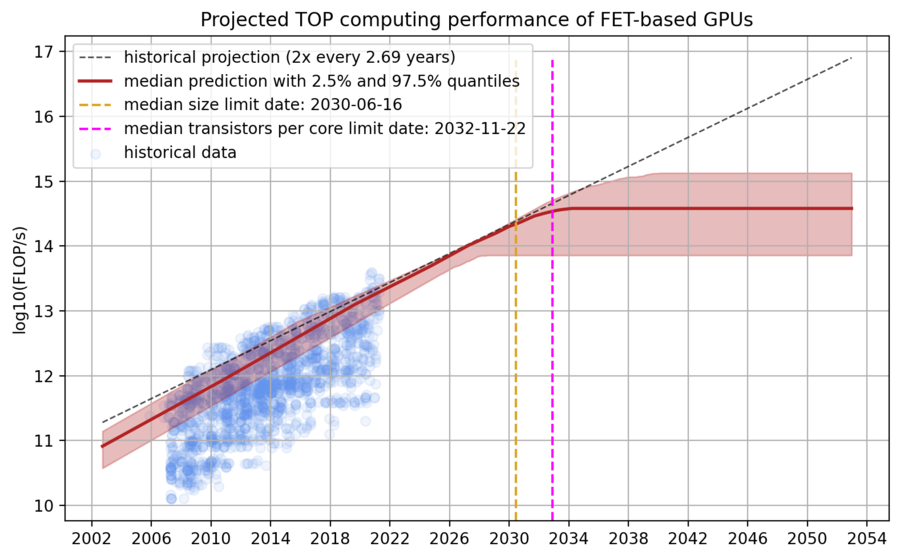
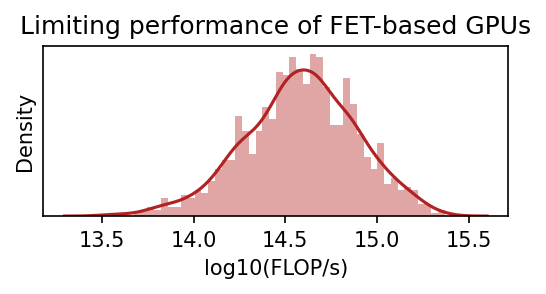
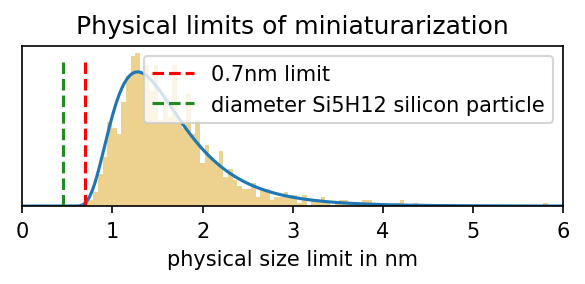
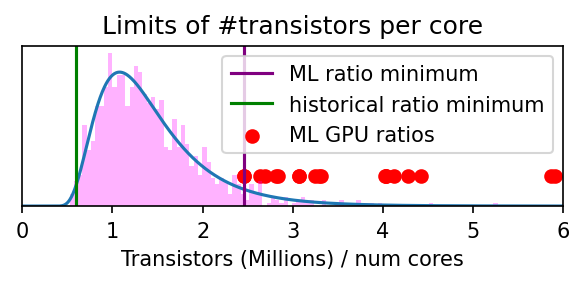
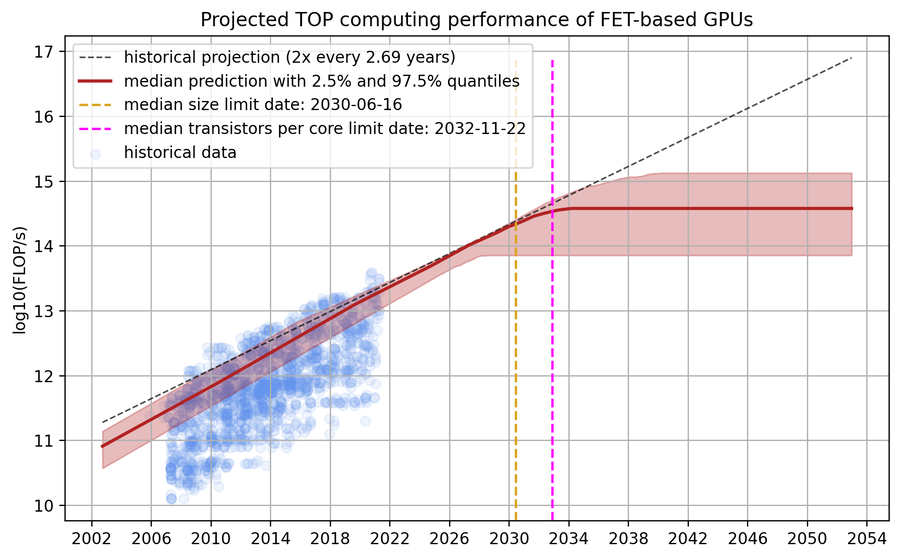
Figure 1. Model predictions of peak theoretical performance of top GPUs, assuming that transistors can no longer miniaturize after scaling down transistors to around 0.7nm. Left: GPU performance projections; Top right: GPU performance when the limit is hit; Middle right: Our distribution over the physical limits of transistor miniaturization; Bottom right: Our distribution over the transistors per core ratio with relevant historical comparisons.
While there are many other drivers of GPU performance and efficiency improvements (such as memory optimization, improved utilization, and so on), decreasing the size of transistors has historically been a great, and arguably the dominant, driver of GPU performance improvements. Our work therefore strongly suggests that it will become significantly harder to achieve GPU performance improvements around the mid-2030s within the longstanding field-effect transistor-based paradigm.
Introduction
As field-effect transistors (FETs) approach the single-digit-nanometer scale, it is almost certain that transistors will run into physical limits that prohibit further miniaturization. Many constraints on further miniaturization have been discussed in the literature, such as thermal noise voltage (Kish, 2001), reliability constraints stemming from imperfections in photoresist processes and random variations in photons (Neisser, 2021), and quantum tunneling (Markov et al., 2019; Frank et al., 2001), among others. These constraints have informed the timelines for the ending of sustained performance improvements driven by miniaturization. For example, the 2022 IRDS roadmap suggests that “ground rule scaling is expected to slow down and saturate around 2028”; similar predictions are offered elsewhere (e.g., Dammel, 2021 and Burg, 2021).
It is less clear how powerful hardware might be in the limit of what is permitted by physical constraints on transistors. Intel, based on internal analysis, projects that chips will be able to perform 1e15 FLOP/s around the year 2030 (Kelleher, 2022). By considering a variety of physical and manufacturing constraints, Veedrac, 2021 argues that improvements in transistor density of 20- to 100-fold are likely achievable, depending on whether or not 3D integration could succeed in producing die stacks with some minimal overheads for wiring and power. Cotra (2020), by considering multiple sources of improved hardware price-performance including transistor scaling, hardware specialization, and additional economic efficiency improvements, argues that improvements in the price of compute—specifically, the amortized costs of computation—will level off after around six orders of magnitude relative to 2020.
We provide a formal model of hardware performance that incorporates physical constraints on transistor scaling. Our work is organized as follows. First, we present a simple model of GPU performance, which consists of a performance model (a model of how GPU performance relates to the features of that GPU) and a feature model (a model of how GPU features change over time given the constraints imposed by the physical limits of miniaturization). We discuss the physical limits of transistor miniaturization and argue that transistor miniaturization will likely halt at or before the point when key dimensions of transistors shrink down to 0.7nm. We describe our estimates and present the GPU performance in FLOP/s predicted by our model over the next three decades. We conclude with a discussion of the limitations of our work.
A simple model of GPU performance
We use a composite of two simple models to generate predictions of GPU performance. The first relates the performance of GPUs to their features (such as the size of transistors, number of cores, etc.). The second is a model that projects historical trends in these features and takes physical limits on transistor scaling into account.
Let \(P(t)\) denote the performance in log peak FLOP/s (FP32, excluding tensor cores) of a chip at time \(t\) with features given by vector \(F(t)\). \(P(t)\) is modeled as follows:
where \(\epsilon(t)\) is some error term that captures variation in performance not explained by feature properties. We specify a second model for the evolution of chip features over time, which encodes physical limits:
where \(F_{\text{max}}\) denotes a vector of limits on \(F(t)\) that are implied by physical limits on transistor scaling and \(u(t)\) denotes an error term that captures variation in the features that occurs orthogonally to time. By separately estimating these two models, we combine these to generate predictions, \(\hat{P}(t)\), which is simply given by
\[ \hat{P}(t) = \hat{\alpha} \times \text{max}(\hat{\beta} t, F_{\text{max}}), \quad \text{(Performance predictions)} \]In doing so, we have constructed a simple model of the evolution of hardware performance that accounts for how chip features relate to hardware performance while incorporating information about the limits on these chip features that are implied by physical limits. The following sections describe the setup of the model and the appendices provide more details.
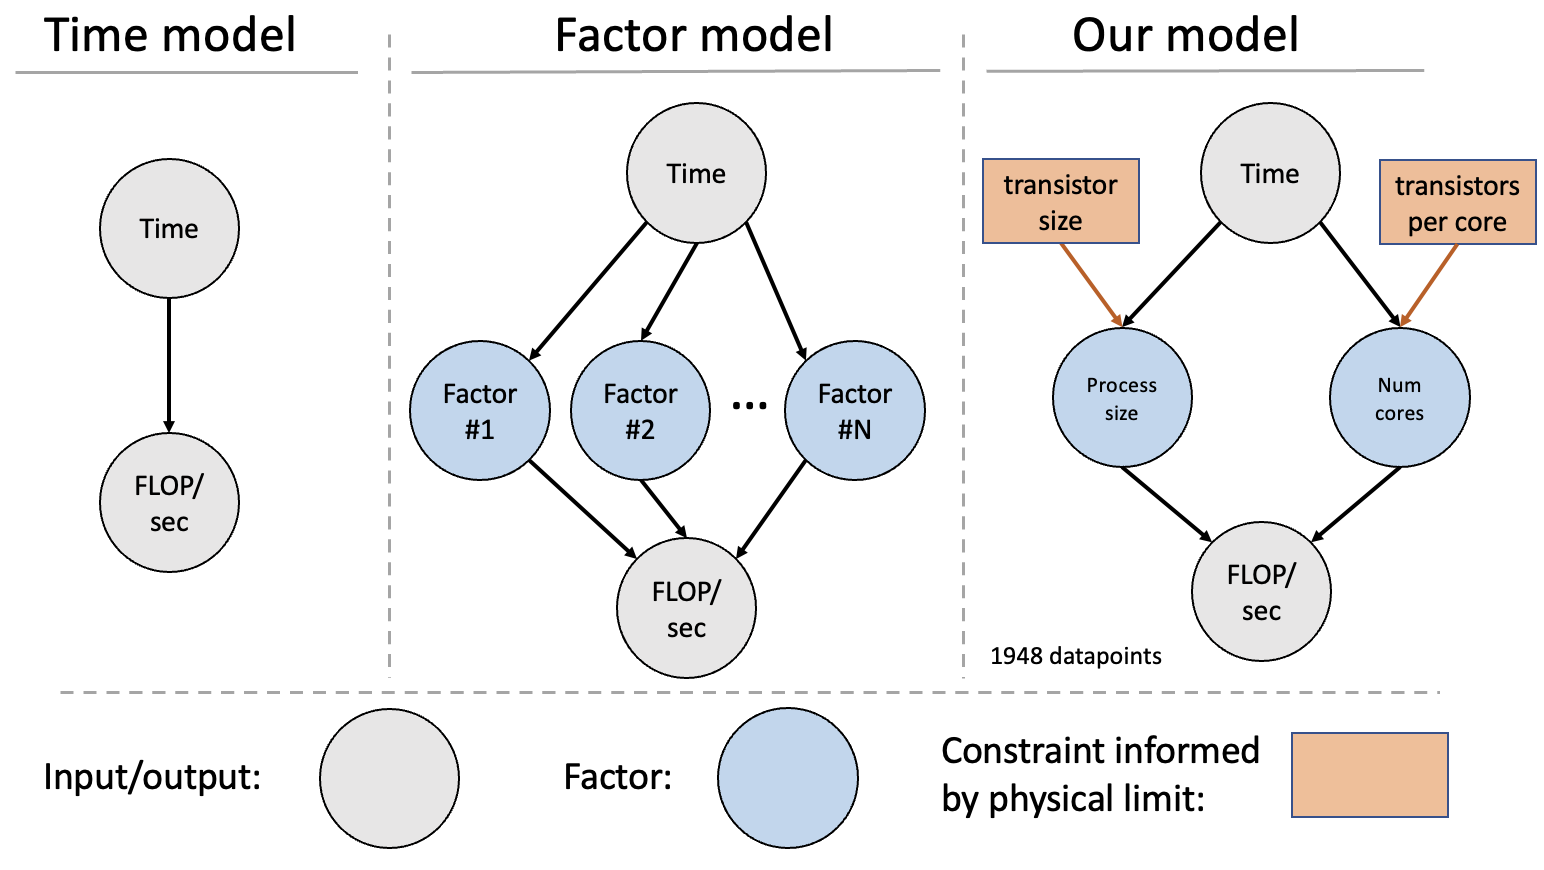
Figure 2: Overview of different approaches to modeling GPU performance. In this piece, we choose a factor model with two variables (process size and number of cores) and include the limits of miniaturization.
Feature and model selection
We want to select features that have a causal effect on FLOP/s such that changes in the factors actually translate into changes in FLOP/s. We, therefore, start with a pool of 21 criteria and narrow them down by using the following desiderata:
- The feature is predictive of GPU performance and there should be a causal relation between this feature and FLOP/s. There should be a well-understood causal relationship that explains why an increase in the values of the feature leads to an increase in FLOP/s (rather than being an effect of, or having a common cause with, FLOP/s).
- The features themselves should be relatively predictable. Specifically, we have a preference for features that improve predictably and regularly over time, and whose variance is small at any point in time (so that each contemporary GPU is relatively similar on that dimension), enabling us to more confidently predict the characteristics of future GPUs.
- The burden is on inclusion, not exclusion. We have a preference for simpler models, given overfitting could severely harm out-of-distribution performance. As a result, we rely on the Bayesian Information Criterion (which strongly punishes model complexity) for model selection.
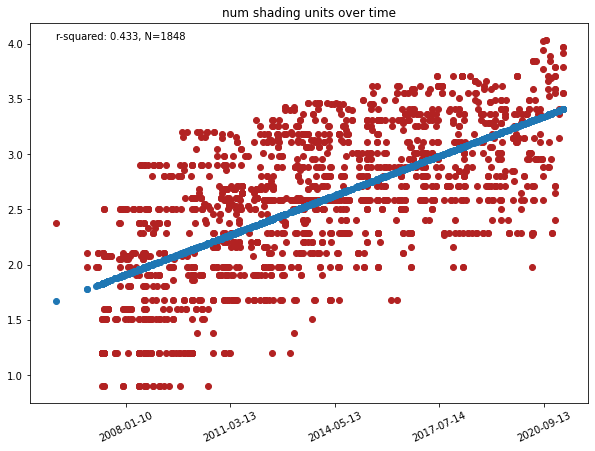
For more details, see Appendix A - feature selection. We find that six features satisfy these desiderata: number of cores, process size (in nm), GPU clock (in MHz), bandwidth (in GB), memory clock (in MHz) and memory size (in MB). For many years now, the clock speed of CPUs and GPUs has only marginally increased or plateaued. Therefore, we think that transistor size and the number of cores are the two key drivers of progress, and clock speed is less important. We think of the first three features as primary variables, (i.e., an increase in the feature directly improves performance), and of the last three features as secondary variables, (i.e., an increase in the feature doesn’t always improve performance but it supports the scaling of a primary variable).
We prefer simpler models for improved interpretability and their reduced likelihood of overfitting the data and thereby producing worse predictions. We select which features to include based on the Bayesian Information Criterion (BIC). We find that our performance model fits the data the best with two features: transistor size1 and number of cores. Moreover, since many factors are strongly correlated with one another, the inclusion of additional features also increased the error bars on the estimates of the relevant coefficients. Therefore, we refrain from adding more than two components.
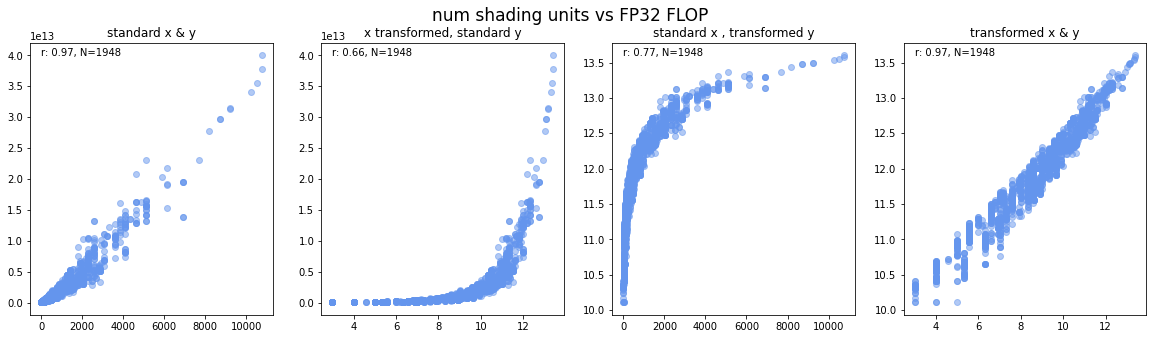
For all components, we use a log-linear fit, e.g., log(feature) ~ time, as a baseline and compare it with different polynomial and sublinear fits of the data. We find that, in all cases, none of the more complex models has a tangible increase (measured as a 0.01 increase in r-squared) over the basic log-linear model. Therefore, we chose to stick with the most obvious log-linear model for all components. See Appendix B for more details.
One could argue that GPU size, and especially die size, increase over time, and our model does not explicitly account for that. However, we think that a) die size is already implicitly accounted for in the number of cores since the number of cores grows faster than the transistor size decreases, b) even if they were unaccounted for, increasing die size would not increase predicted limiting performance substantially and c) larger GPUs might improve performance but not price-performance which is, in some sense, ultimately what matters for compute progress. We provide a detailed analysis of these arguments in Appendix E.
Physical limits of transistor miniaturization
There have been multiple estimates of physical size limits of field-effect transistors (see table in Appendix C). In our projections, we enforce a prior over the miniaturization limits of FET-transistors (See Figure 3). This range coincides with the range—roughly between 0.7nm and 3nm—that was constructed by surveying existing research on the physical limits of transistors, with the exception that we did not assign much weight to purely proof-of-concept results (such as, for example, single-atomic-layer FinFETs), where we expect reliability and performance issues to be major obstacles to mass-production.
Figure 3: Distribution over the limits of miniaturization we use in our model. The parameters of the distribution are chosen to reflect what we think of as a hard boundary at 0.7nm and such that most probability mass is smaller than 3nm. We use a log-normal distribution with mu=0, sigma=0.5 and shift it by 0.5 to the right.
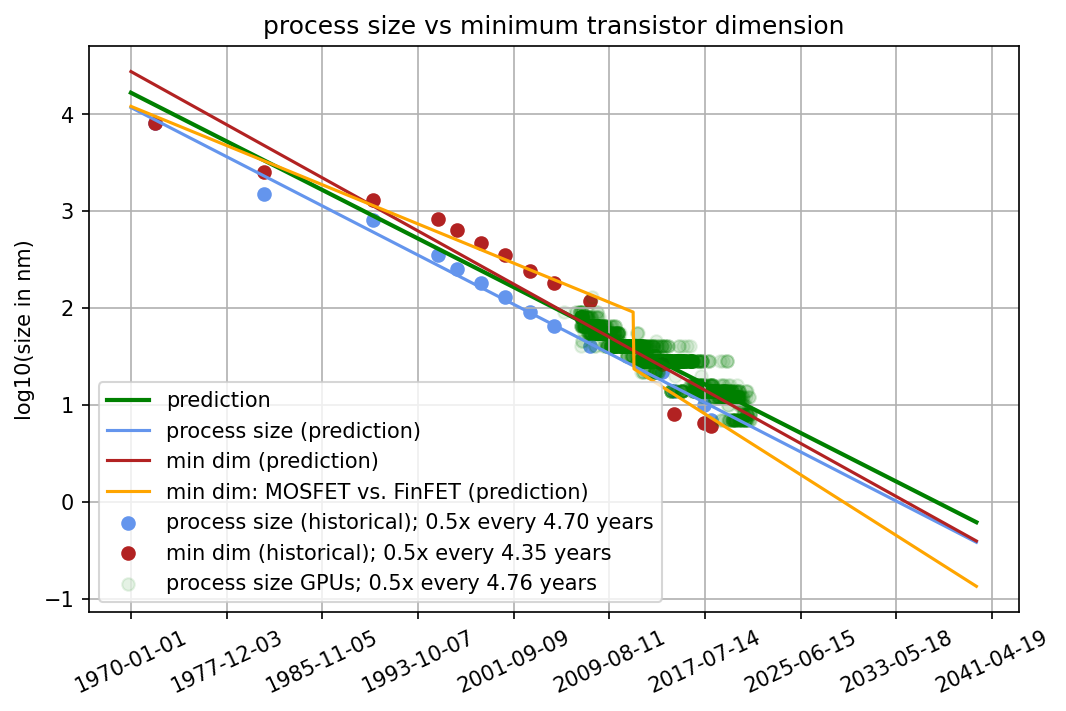
We found that, historically, process size and the minimum dimension of the transistor very strongly correlate and, therefore, extrapolating either produces very similar predictions (see Figure 4 and Appendix D). We chose to keep process size as the predictive factor for two reasons. First, we think it’s not clear that the minimal dimension of a transistor is a better measurement than process size. Just because the smaller dimension has hit its limit does not mean the larger dimension has. Second, we have very few data points for FinFET-based GPUs. Thus, predictions based on them might be misleading or inaccurate. For the rest of the report, you can thus think of “process size” as an approximation to transistor size.
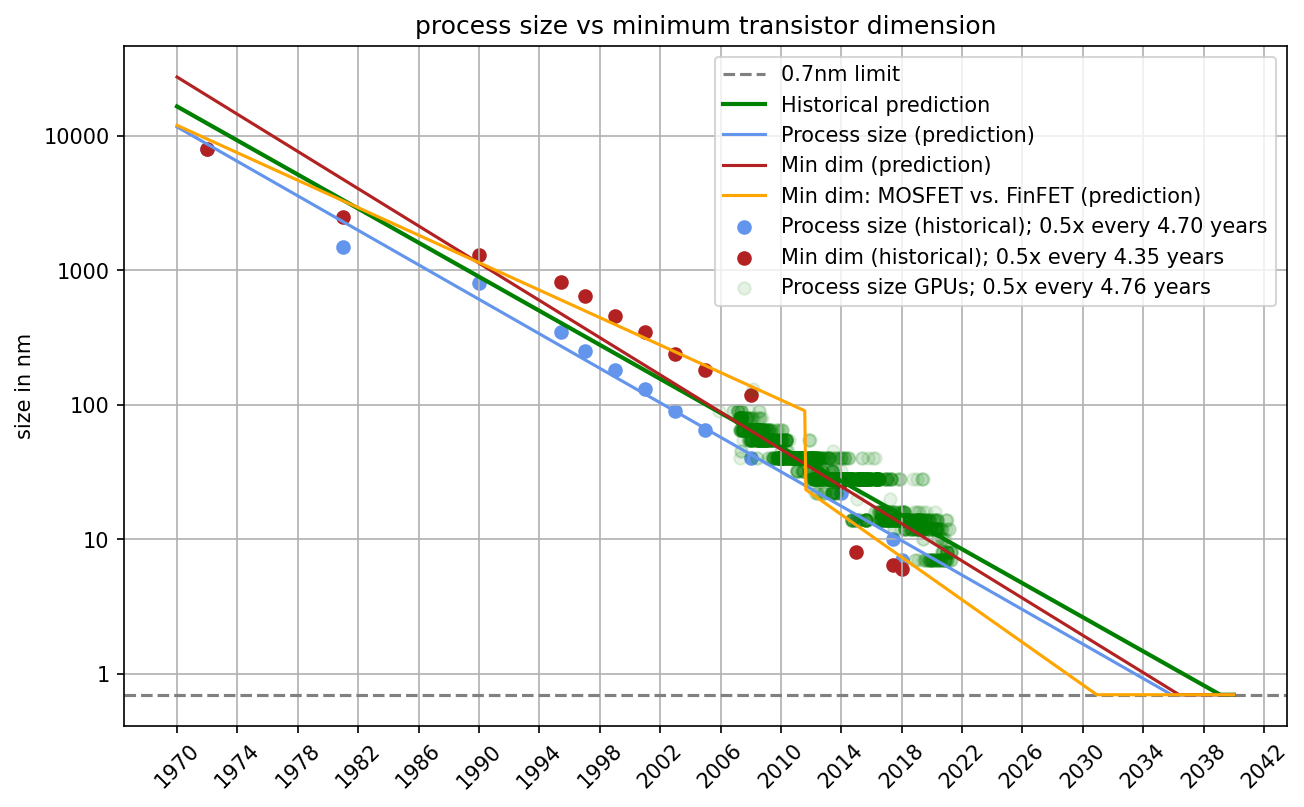
Figure 4: Comparison of process size and minimum transistor dimension. We find that both scale very similarly even when we account for a MOSFET vs FinFET distinction. Therefore, we conclude that we can use process size as a decent approximation for transistor size in the rest of this piece.
Limits on the number of cores
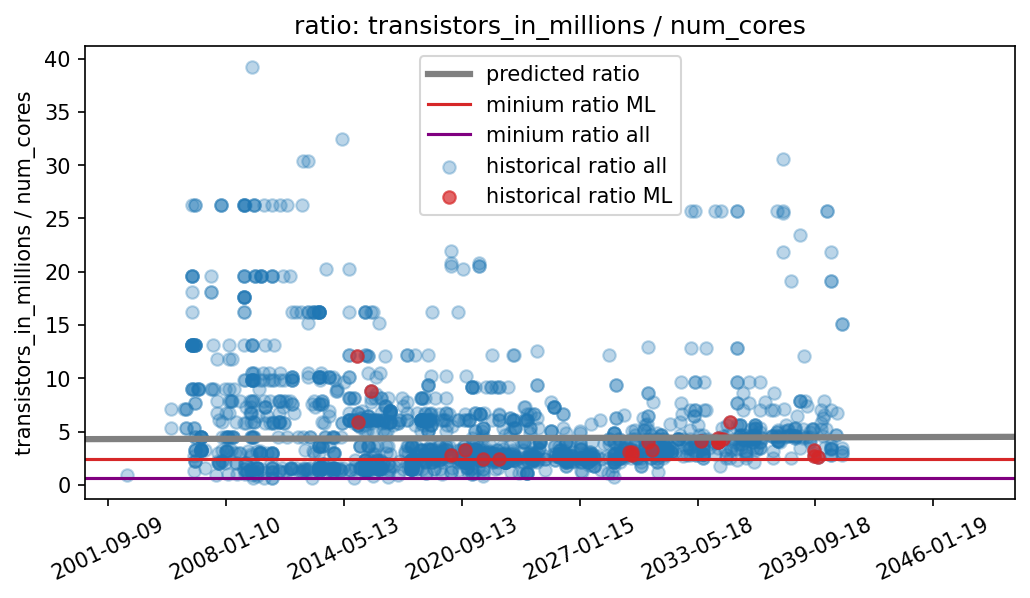
Once the physical limit of transistor size is hit, transistor miniaturization ceases to be feasible. However, increasing the number of cores on the chip is still possible, which improves performance by enabling more effective parallel computation. When the number of transistors ceases to increase, we expect that the number of cores will continue growing until it hits the limit of the number of transistors required to produce high-performing cores.
We enforce a prior over the number of transistors per core that is informed by our dataset (see Figure 5). Specifically, we find that the minimum number of transistors per core has been 600k, while this minimum ratio of GPUs used in ML (where workloads are generally highly parallel) is on the order of 2.4M.2
Figure 5: With the information from the previous figure, we construct a distribution that reflects our best guess of what the limit of the number of transistors per core is. We think it is likely lower than what current state-of-the-art ML GPUs can achieve (since they are likely not optimized for that ratio) but a bit higher than the historical minimum. We use a log-normal distribution with parameters mu=0.3 and sigma=0.5
Predictions
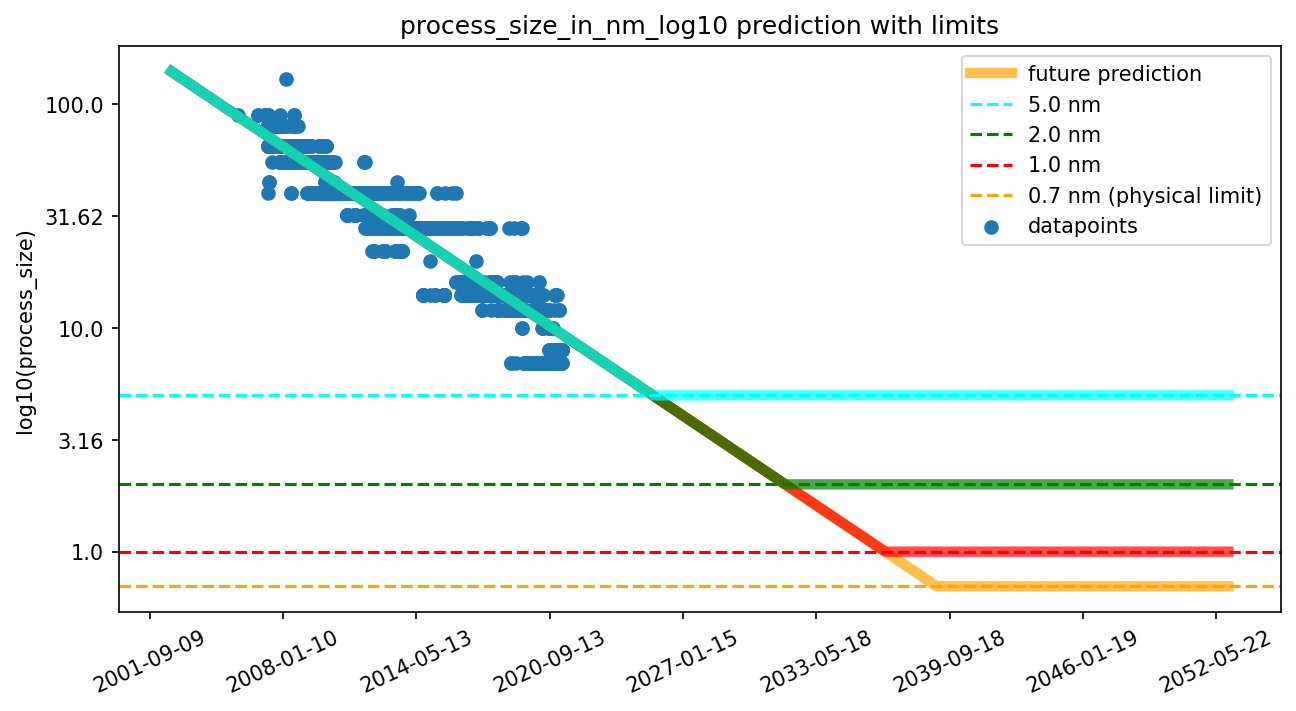
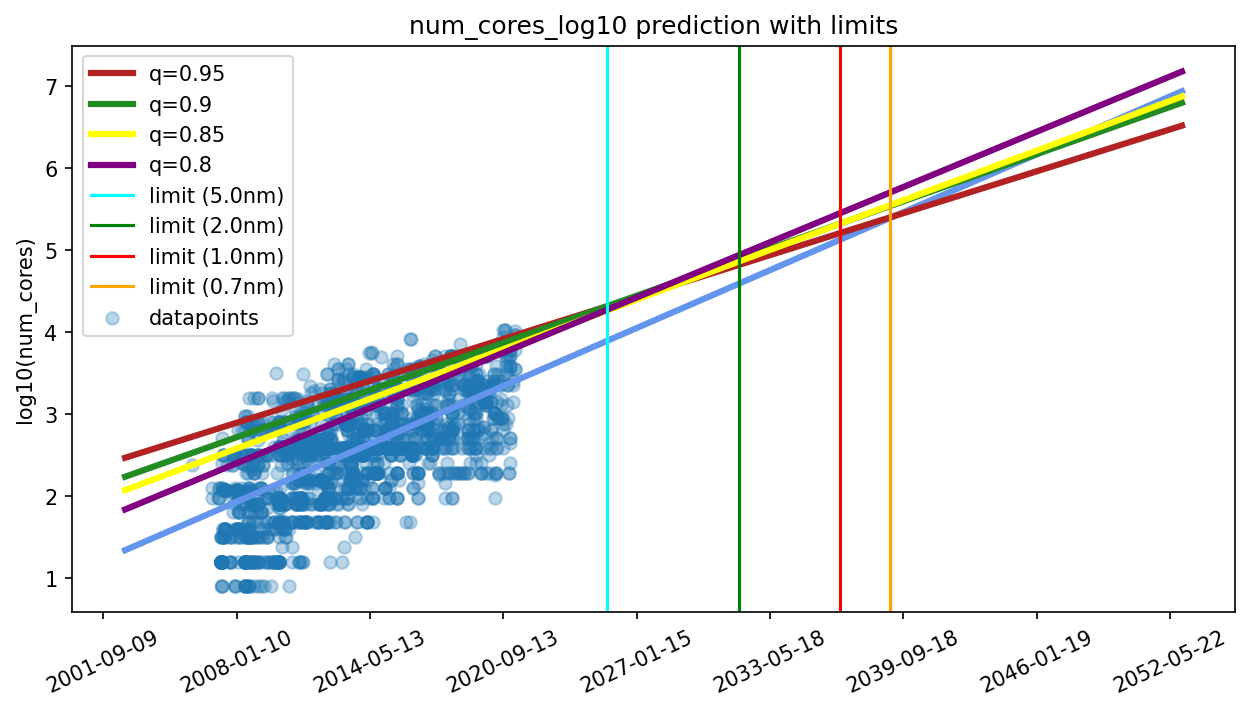
We predict the performance of TOP GPUs from quantile regressions of the historical data that take the two limits into account, i.e., the physical size limit of transistors and the number of transistors per core. Concretely, we fitted a 5th percentile quantile regression for the log10(process size) ~ time model (because smaller transistors imply higher performance) and a 95th, 90th, 85th and 80th percentile quantile regression for the log10(number of cores) ~ time model. We then draw uniformly from these four regressions. The reason we fitted multiple quantile regressions for the cores model is that they yield different slopes (rather than just different intercepts), and we have no strong reason to prefer one slope over the other. The predictions that result from these two regressions are then fed into the performance model. Additionally, we draw samples from the distributions over the transistor miniaturization limit and the transistors per core limit and adapt the projections accordingly. This process is repeated 1000x times and yields the distribution over projections that can be seen in the next figure. More details can be found in Appendix B.

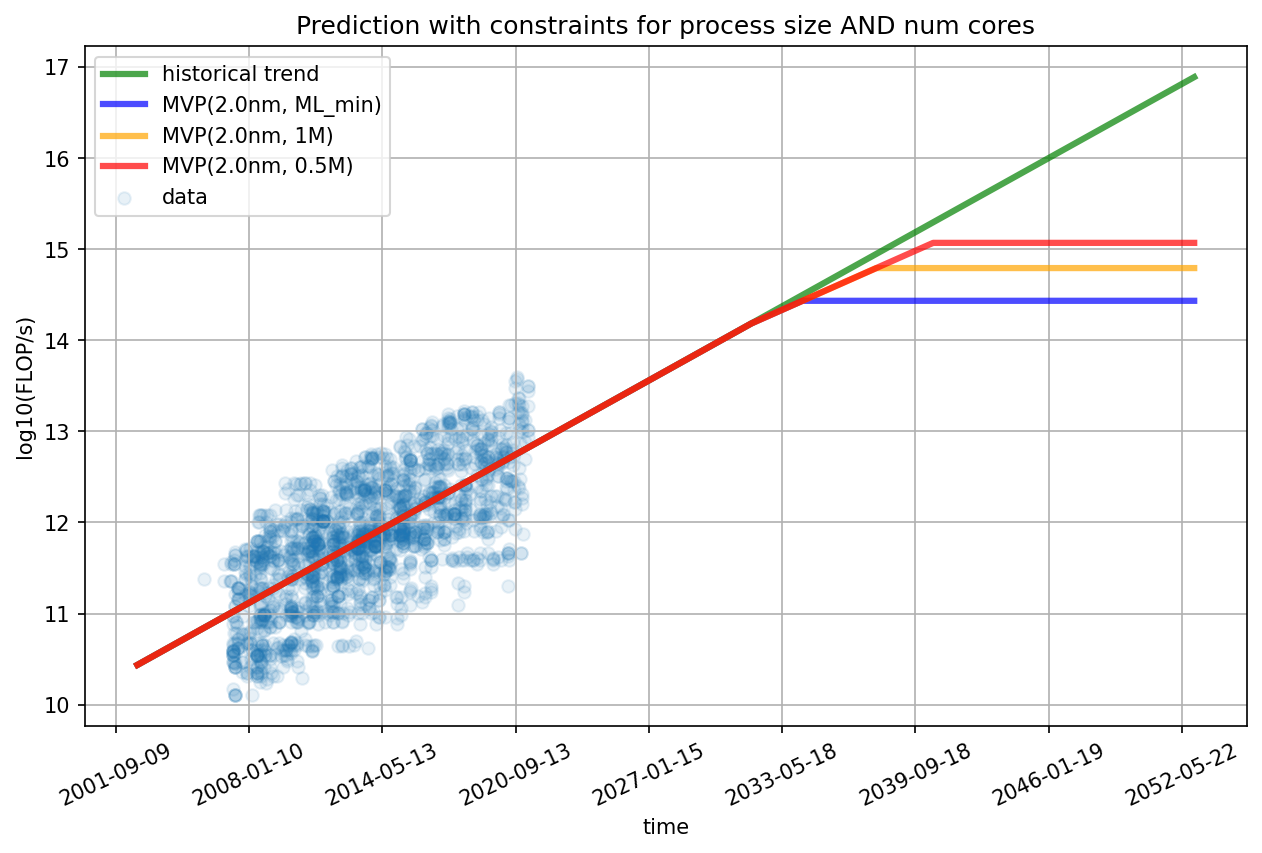
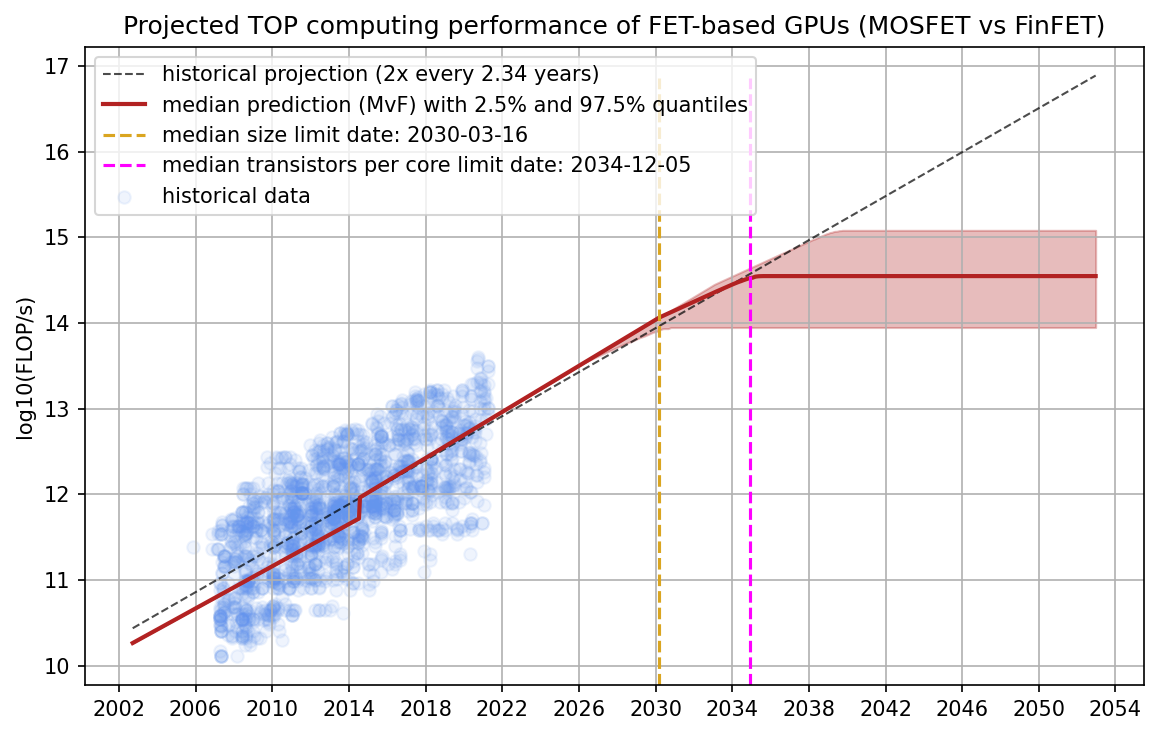
Figure 6: A distribution over projections of TOP GPU performance. The historical projection comes from a 90th-percentile regression of the dataset. The model predicts that the median dates for the two limits are ~2030 and ~2033 and that the limiting performance is between 1e14 and 1e15 FLOP/s.
Every predicted trajectory has two kinks: the first corresponding to when the physical limit of transistor size is hit, and the second when the number of transistors per core can no longer be decreased without losses in performance. After the second limit is hit, our predicted trajectory is flat because there are no further avenues of progress from the two factors our model considers.
Our model predicts that the median dates for the two limits are 2030 and 2033. Furthermore, the model predicts that the performance limit is hit between 2027 and 2035 with a maximum performance of 1e14 and 1e15 FLOP/s. If we assume constant prices and an amortization period of three years, this would mean that the price per FLOP for the limiting GPUs based on field-effect transistors is between 1e22 FLOP/$ and 1e23 FLOP/$.3
Limitations
In this work, we make a lot of assumptions that lead to limitations:
- We assume the developments in transistor size continue as they did in the last 15 years. However, there might be reasons to assume that this speed will decelerate, e.g., R&D spending can’t continue exponentially, ideas are getting harder to find, etc.
- We don’t make any claims about limits other than size. In particular, we have not explicitly factored in heat dissipation, but some of the estimates we base our distribution over limits on implicitly include limits from heat dissipation.
- This prediction is only applicable to the current paradigm of GPUs. Our predictions don’t make claims about other paradigms such as quantum computing or neuromorphic computing.
- We do not account for the possibility of 3D chip designs improving GPU performance
- We assume the number of transistors per core is lower-bounded by roughly the minimum transistors per core that we have historically seen. However, computer architects might focus on reducing the number of transistors per core beyond its historical limit once miniaturization is no longer feasible.
- We assume that you can scale the number of cores by at least a few orders of magnitude without drops in performance. This assumes that ML algorithms can be parallelized to a massive extent. We are not sure this is true, even though most current ML progress is based on parallelization.
Appendix
A. Feature selection (details)
B. Model selection
C. Physical size limits of transistors (details)
D. Process size vs. transistor size
E. Growth of die sizes
F. Deviations from the current paradigm
G. Estimates
Notes
-
In recent years, chip manufacturers have chosen to report a quantity called “process size” rather than the actual minimal width of a transistor (such as fin width or gate width).

-
We assume that future GPUs roughly have the same size as today’s GPUs. If the size of the GPU grows by 10x, then you can fit 10x more cores into it without any changes in transistor size or the number of transistors per core. However, we don’t expect that incorporating increasing die sizes changes our predictions much; see Appendix E.
-
Of course, the amortization period might be longer than three years once miniaturization is exhausted, as when this happens, we should expect longer replacement cycles, which would incentivize longer usage of state-of-the-art GPUs.
-
Note that the channel length and gate length are usually roughly similar in size (source).
About the authors